
Hi, I have AquaTouch 3.6.7. I added a few of my own, saved to another preset. I had to add a few apps to the "unsupported apps" and add links to browsers to handle website specific behaviors. I don't know what else I did. Now, when I activate both AquaTouch and my own preset, BTT configuration process most of the time occupies 100+ of CPU usage and becomes unresponsive. When that happens, I had to force quit and restart, until (if I'm lucky), the configuration window is responsive and I can deactivate either AquaTouch or my own preset. I had a fresh reinstallation of BTT and AquaTouch. So I'm sure the only thing I edited for AquaTouch are the lists in "unsupported apps" and "Browser X - Generic". Is there a way to debug it?
I have the same problem for a few days - even without AquaTouch. Maybe it is due to the last Big Sur update.
Can you check if also the TouchBarServer process is running on 100% CPU in these situations?
As far as I know, only the BTT process was running on 100%+ CPU.
Edit:
The unresponsive behavior is random. It was ok most of the day, but a moment ago, when I restarted the configuration window, BTT became unresponsive again.
At first, the TouchBarServer was ok. But before I force quit BTT, I did see TouchBarServer started to consume more CPU resource. I was about to force quit BTT, so I did not see how things would develop. If it happens next time, I'll wait for a long time and see how TouchBarServer would behave.
I have also this behaviour sporadically and BTT freezes as soon as I open the configuration, sometimes also when a WebView is displayed. Then the BTT and the TouchBarServer process run amok.
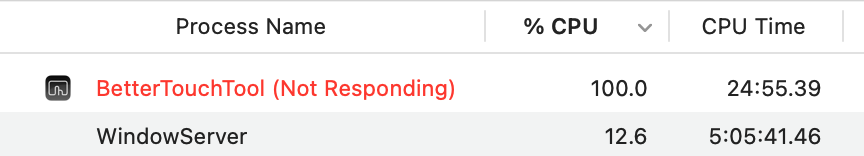
The issue came up again, and I managed to take a screenshot of three processes that are running at high CPU level. The other two do not always run at such high levels, but BTT always does.
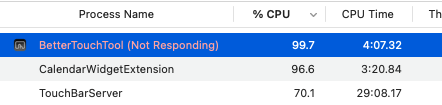
In my case it looks like this:

I have written a bug report:
1 Like